Last week, I wrote that the marine insurance market was running on vibes — that there's a structural mismatch between data that updates every 15 minutes and pricing frameworks that update quarterly.
I didn't expect the proof to arrive this fast.
The Strait of Hormuz — the 21-mile-wide channel through which roughly 20% of the world's oil and 25% of its LNG passes daily — is effectively closed. The consequences are cascading through every layer of global maritime logistics, and the data tells a story that the headlines haven't caught up to yet.
What happened
Strikes on energy infrastructure across the Persian Gulf have shut down or severely damaged facilities at Qatar's Ras Laffan (12.8 mtpa of LNG capacity — roughly 3% of global output), Saudi Arabia's Yanbu terminal on the Red Sea (the backup route for Gulf crude), and multiple loading berths along the UAE coast.
The IEA is calling this the largest supply disruption in the history of the global oil market. That is not hyperbole. It's arithmetic.
The data surface right now
Here's what our intelligence signals are showing as of this morning:
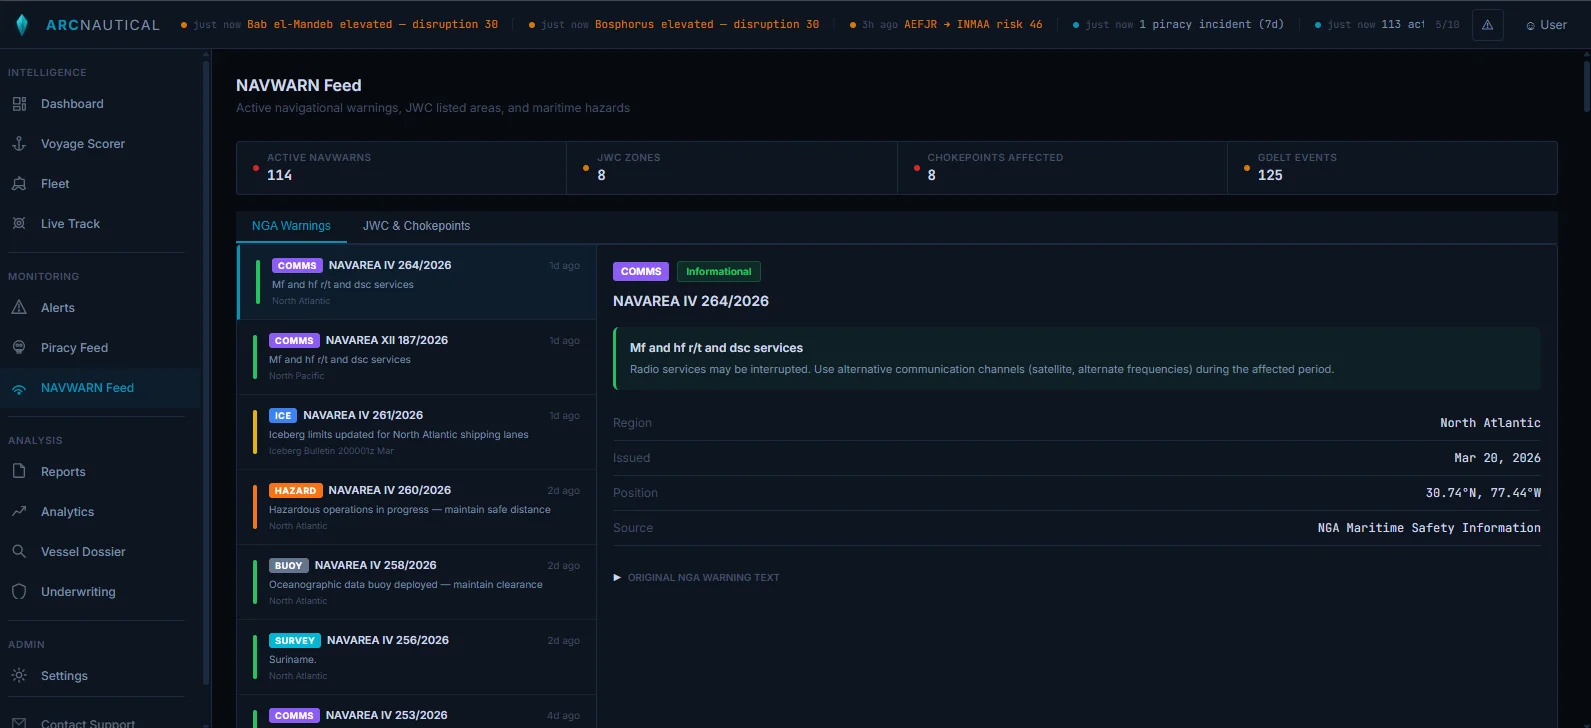
Navigational warnings: A significant cluster in NAVAREA IX (Arabian Sea and approaches). Multiple warnings reference suspended pilotage, port closures, and mandatory avoidance zones that didn't exist 72 hours ago.
Chokepoint disruption: Two days ago, I wrote about how Malacca was scoring disruption 50 — the highest of any strait we tracked. Hormuz has blown past that. The combination of active conflict indicators, suspended vessel traffic services, and concentrated NAVWARN density puts this corridor into territory our scoring model hasn't seen before.
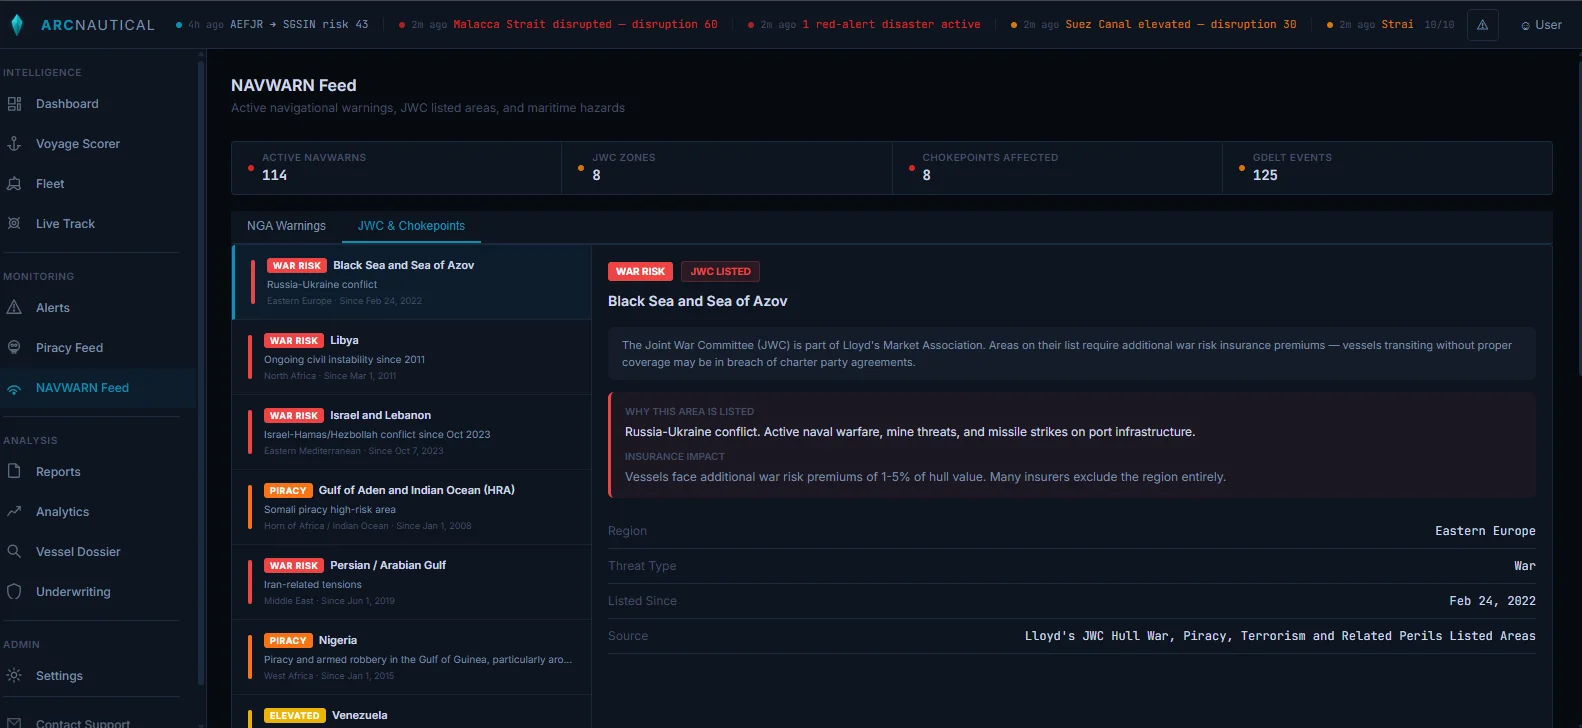
JWC Listed Areas: The Joint War Committee's listed areas already covered much of the Persian Gulf and Gulf of Oman. But the JWC circular that underwriters are working from was issued before this week's escalation. Premium rates calculated against that baseline are already obsolete.
Vessel positioning: AIS data shows vessels queuing outside the strait, with laden tankers and LNG carriers either holding position or beginning the reroute south around the Cape of Good Hope — adding 10-15 days and roughly 3,500 nautical miles to any Europe-bound voyage.
What the reroute actually costs
The Cape reroute isn't just longer. It's dramatically more expensive across every dimension that matters to a fleet operator or underwriter.
We ran the numbers on a representative voyage: a laden VLCC from Fujairah to Rotterdam.
| Metric | Via Hormuz + Suez | Via Cape of Good Hope | Delta |
|---|---|---|---|
| Distance | ~6,300 nm | ~11,500 nm | +83% |
| Transit time (14kt) | ~19 days | ~34 days | +15 days |
| Fuel (HFO) | ~1,050 MT | ~1,920 MT | +83% |
| CO2 emissions | ~3,270 MT | ~5,980 MT | +83% |
| Bunker cost (@$500/MT) | ~$525,000 | ~$960,000 | +$435,000 |
That's 83% more fuel, 83% more CO2, $435,000 more in bunker costs, and 15 extra days of crew wages, insurance, and tied-up capital. For a single voyage.
The vessels that scored "moderate risk" on a Fujairah-to-anywhere route last week are now uninsurable at standard rates. The risk didn't change gradually. It changed overnight.
The CII problem nobody's talking about
Here's what isn't in the headlines yet: the Cape reroute doesn't just cost more in fuel and time. It destroys CII ratings.
The Carbon Intensity Indicator — IMO's MEPC.339(76) framework — measures grams of CO2 per deadweight-tonne per nautical mile. A longer route with the same cargo means a higher CII value, which means a worse rating.
CII = (fuel consumed × CO2 factor) / (DWT × distance). A Cape reroute adds 83% to both fuel and distance. But CII doesn't scale linearly with distance — the increased fuel consumption from weather, speed adjustments, and longer exposure pushes the ratio worse than the distance alone would suggest. A vessel on track for a B rating could drop to D or E after multiple reroutes. Under the 2026 tightening (11% reduction from IMO reference line), the margins are already razor-thin. Forced reroutes blow those margins apart.
For fleet managers trying to maintain compliant CII trajectories, the Hormuz closure isn't just a routing problem. It's a regulatory problem that will compound over the calendar year. Every Cape diversion chips away at annual CII performance. By Q4, vessels that made multiple diversions may face corrective action plans regardless of whether the diversions were their choice.
The pricing gap
This is the structural issue I keep coming back to.
War risk premiums for Gulf transits are surging — but they're surging from a baseline that was set by a quarterly committee process. The JWC meets four times a year. The listed area designations lag the actual threat environment by weeks or months. When a chokepoint goes from "elevated" to "closed" in 48 hours, the pricing framework doesn't have a mechanism to keep up.
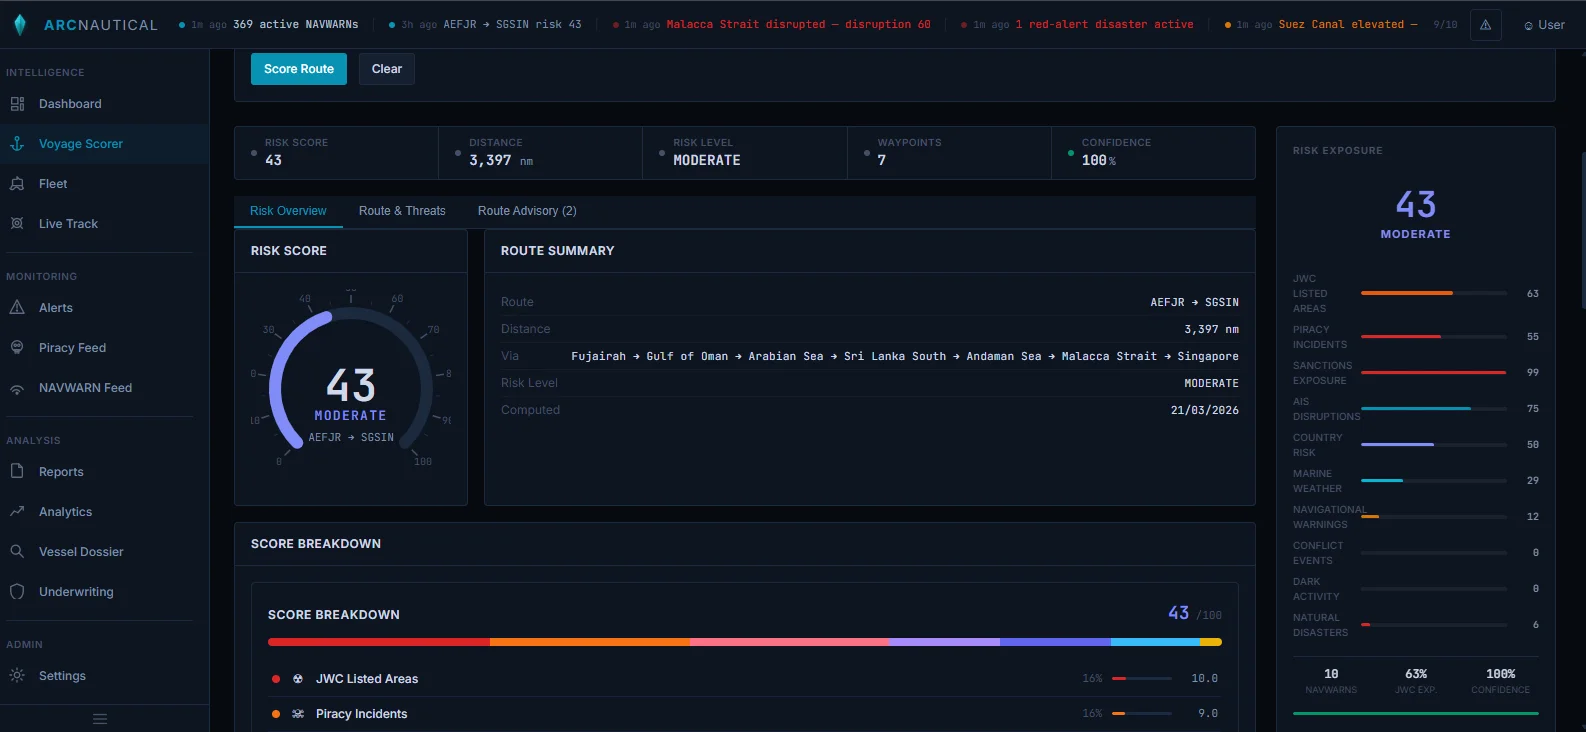
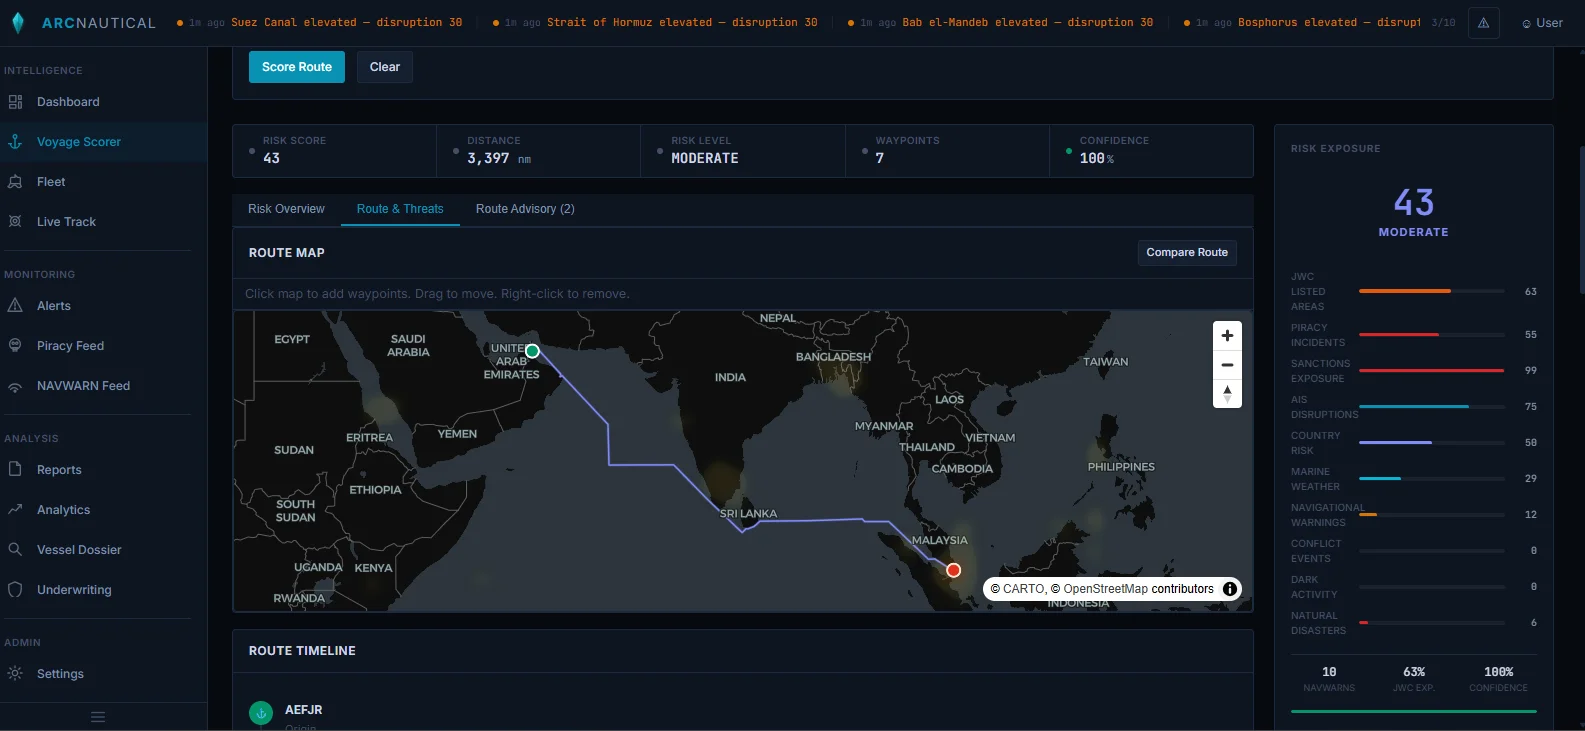
The screenshot above shows what a Gulf route looks like through our scoring engine right now. Ten independent intelligence signals, each updating on its own cadence — from piracy incidents (refreshed every 6 hours) to NGA broadcast warnings (refreshed hourly) to JWC listed area coverage (updated when the committee publishes). The composite risk score reflects the weighted combination of all active signals for the actual route geometry.
This is what it looks like when risk pricing lags behind risk reality by 90 days. The data is there. The frameworks just don't consume it fast enough.
What we're watching next
Three things we're monitoring in the intelligence signals over the coming days:
- Pilotage resumption in the strait. When Oman and UAE maritime authorities restore vessel traffic services, it'll show up in NAVWARN withdrawals before it shows up in the news. We're tracking this in real time.
- LNG carrier repositioning. Qatar's fleet has limited options. If carriers start repositioning to non-Gulf loading terminals (US Gulf Coast, Australia), it signals a longer-term supply chain restructuring, not just a temporary disruption.
- Cape reroute saturation. The Cape of Good Hope route is already congested from Red Sea diversions. Adding Gulf diversions on top of that creates a bottleneck at the southern tip of Africa with its own risk profile — piracy exposure off Mozambique, weather in the Agulhas current, and port congestion in Cape Town and Durban.
Every vessel that reroutes around the Cape absorbs 15 extra days of utilization. That's 15 days that vessel isn't available for its next voyage. Multiply across hundreds of diversions and you get a fleet-wide capacity crunch that drives freight rates up even for routes nowhere near the Gulf. The Hormuz closure doesn't just affect Gulf transits — it tightens global tonnage supply.
The bottom line
The Hormuz closure stress-tests everything the maritime intelligence industry has been building toward. Real-time data aggregation isn't a nice-to-have when a chokepoint closes overnight. It's the difference between seeing the risk before the market prices it and scrambling to react after.
We built ArcNautical to aggregate 10+ intelligence signals into a single risk surface that updates continuously — not quarterly, not weekly, not when someone remembers to check. The route scoring, the NAVWARN feeds, the threat overlays, the CII calculations — all of it refreshes on cadences measured in minutes and hours, not months.
If you're managing fleet exposure through this crisis and want to see what the data looks like in real time, the platform is live.
Screen any vessel, free
Enter an IMO number for live sanctions status (OFAC, EU, UN, UK), ownership-opacity scoring, and an A-E vetting grade in seconds. Free, no signup.
Run a free vessel check